
Welcome to Logos Red, I go bylogos and:
As a penetration tester, you have probably wondered before:
What does a DDoS attack actually look like?
In this post, I will help you visualize one using Wireshark and a free IP database from Maxmind. This will allow you to see the geolocation (country, state) of any IP address from a sniffed packet in a pcap. And will also help us with creating an automated diagram in Wireshark.
My Promise
This post will finally end your meaningless search for a valid answer. You will leave knowing how to create map diagrams with Wireshark and with a better understanding DDoS attacks.
If there are still any questions left, let me know so I can add it to help the next person who will arrive here.
My Goal
To help you improve in less time than it took me and to make sure you leave with what I promised.
I want you to join our community and for this to be a place that you revisit often.
Requirements
- A basic understanding of networking and Wireshark
- An installation of Wireshark
Using MaxMind’s Geolocation Database with Wireshark
What is a geolocation database?
A geolocation database is a collection of IP addresses and their respective location. These databases are usually created through data from Regional Internet Registries, web scraping, and user-contributed data.
What these companies do is scrape as much data, clean it, normalize it and then sell it off to companies.
I won’t go into the ethical concerns about these databases; this is why you should use a VPN for your privacy.
How to download the geolocation database?
- Go to the following link and sign up for a free account: https://www.maxmind.com/en/geolite2/signup
- After you’ve signed in go to the Download Files tab https://www.maxmind.com/en/accounts/current/geoip/downloads
- Download the databases in the gzip binary format and decompress them

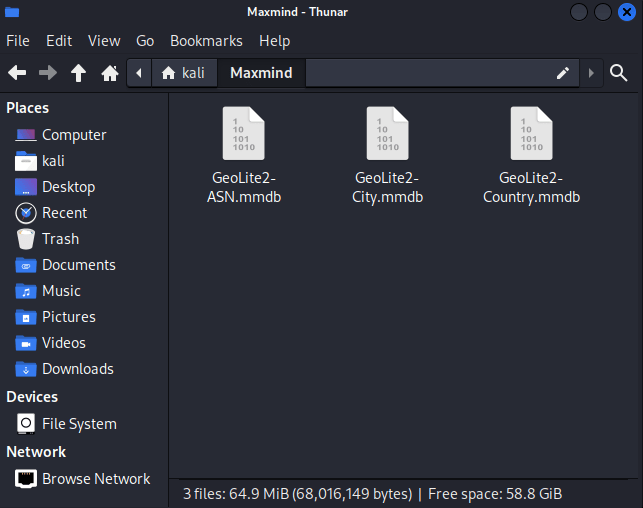
4. You only need the .mmdb files so you can extract those into a single folder ( if you’re on Linux move them to /usr/share/GeoIP)
5. Start Wireshark. Then, go to Edit → Preferences → Name Resolution. Add the location of your folder with the databases. If you’re on Linux and moved them to /usr/share/GeoIP you can skip this part.

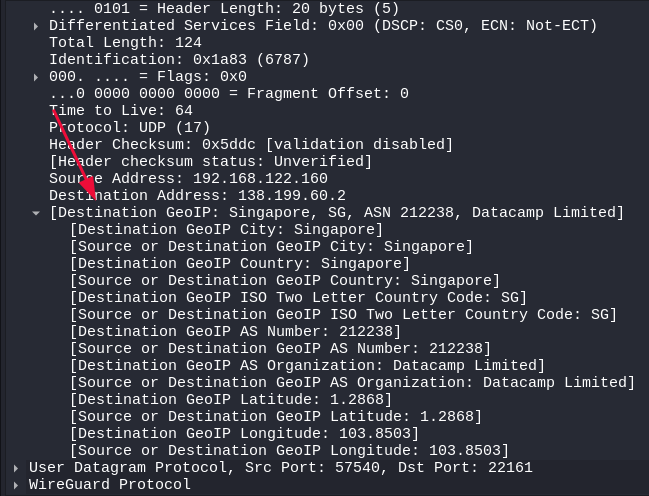
You can now sniff some data packets. Under “Internet Protocol Version 4,” you should see a GeoIP header.
Where can I get some DDoS examples?
I found this really amazing GitHub repository that contains multiple real-life collections of DDoS attacks.
This is the link to the GitHub repository.
Download any of the files (I went with the first one, a simple SYN-ACK DDoS attack) and open it up in Wireshark.
I will explain some of the smoking gun evidence that shows the DDoS attack in a bit. But first, I really want you to get that amazing Wireshark map to visualize traffic.
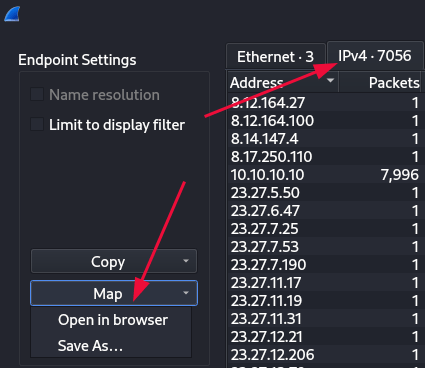
Go to Statistics -> Endpoints
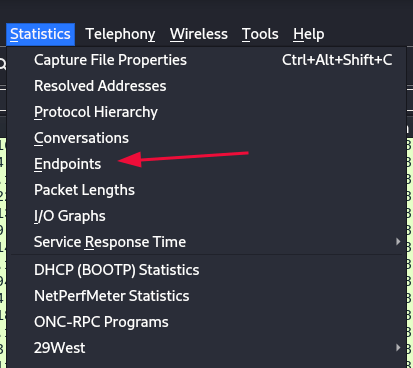
In here, click on IPv4 and then on Map -> Open in browser.
You might get an error such as the following:
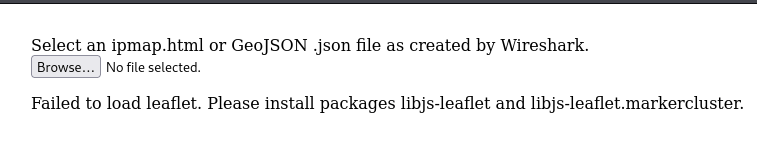
And if so, you need to install the packages described there:
sudo apt install libjs-leaflet libjs-leaflet.markerclusterReopen the map and:
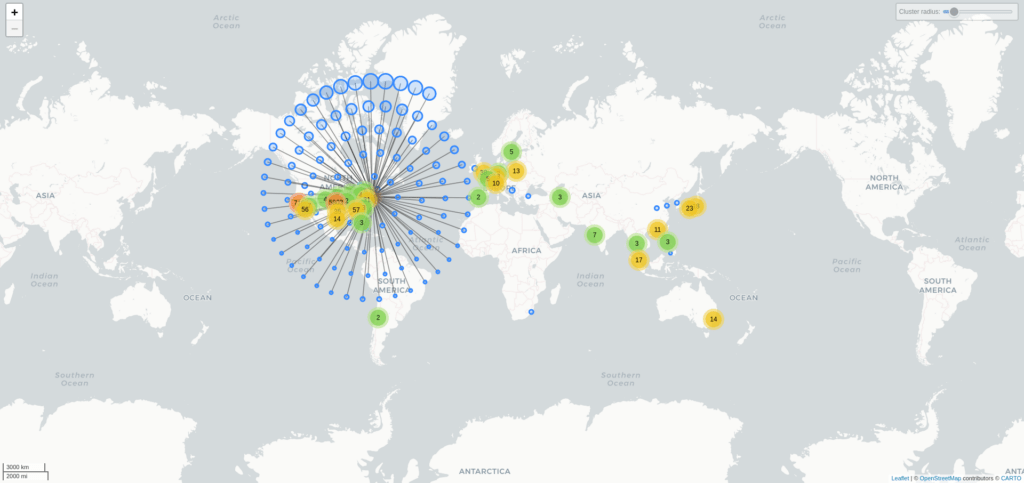
Now that is really beautiful.
You can click around and see the bulk of each location, see the AS and bits transmitted.
This would of course help tell you if you are under attack.If you see a large number of unusual countries, then there’s a higher chance.
Expert tip: Drag to add filters
This does not get taught often enough. You can drag and drop filters in Wireshark instead of typing them in, as such:

Smoking Guns: How is this a DDoS attack?
First of all, I want to showcase the information given to us by the DDoS pcap file name:
“amp.TCP.reflection.SYNACK.pcap”
This tells us the following, explained briefly:
- Amp (Amplification): This is a type of attack where an attacker makes a small request to a server using a spoofed IP address. The server then sends a larger response (hence amplification) to the spoofed IP address instead of the attacker.
- TCP: We are dealing with a SYN-ACK attack so we will see TCP not UDP
- Reflection: This is almost exactly the same as amplification. Just that it doesn’t necessarily involve amplifying the response.
- SYN/ACK: This is what a server responds with after it receives a SYN packet in the three-way TCP handshake. What our focus will be on.
You can spoof IP addresses?
Indeed. Pretty interesting right? The whole premise is to trick a server into sending data to somebody else. It is up to your computer to fill out the “Source Address” field, so you can modify it.
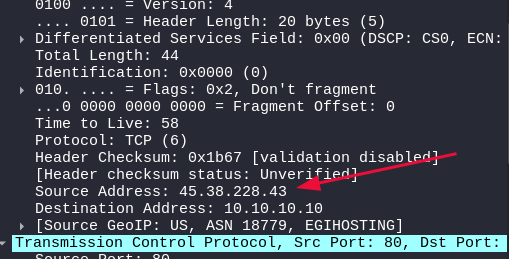
Granted, there are security measures put in place to stop this such as ingress filtering, but it’s still possible.
Indicator 1: Basic overlook
You should be able to instantly tell that this is a DDoS attack by the absolute sheer amount of SYN ACKs that are coming in from a multitude of IP addresses.
Scrolling through the endpoints you can see that most of these IP addresses are only sending a single packet. That packet being a TCP SYN ACK.
We can filter for TCP SYN-ACKs with the following Wireshark filter:
tcp.flags.syn == 1 && tcp.flags.ack == 1If this was a SYN flood attack we could set tcp.flags.ack to 0 and see the amount of SYN packets.
Indicator 2: Repeating window length
If you take a look at the right side, you can see that the Window field keeps repeating.

The chances of that happening under normal circumstances is absolutely 0. The repeating values are also unusually low, sitting at 1400, 8192 or 29200. You can view your own SYN ACK packets and see that usually the window length is around 65k.
The window length is what tells the responder how much more data the sender is willing to accept back. Small values are really suspicious, especially when repeating.
Here is an example of a normal TCP packet, the Window being 65k.
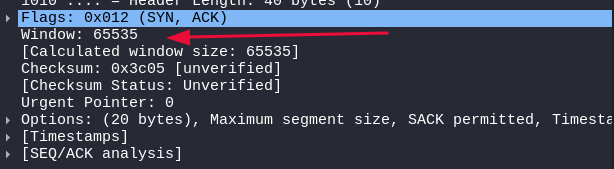
Of course, it’s also normal to see small window sizes, the sender might not have enough resources to accept a lot of data. But in this context, it’s a red flag.
Indicator 3: Small header length
If we take a look at the header size of these packets, they’re sitting at 24 bytes each. Which is unusual since normally they’re at 32/40 bytes.
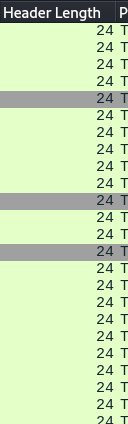
The header contains all the fields such as source and destination port,flags, sequence number. At minimum, it’s sitting at 20 bytes, but with options this can be taken up to 60 bytes.
Which is why it’s unusual to have a repeating pattern of 24 byte headers.
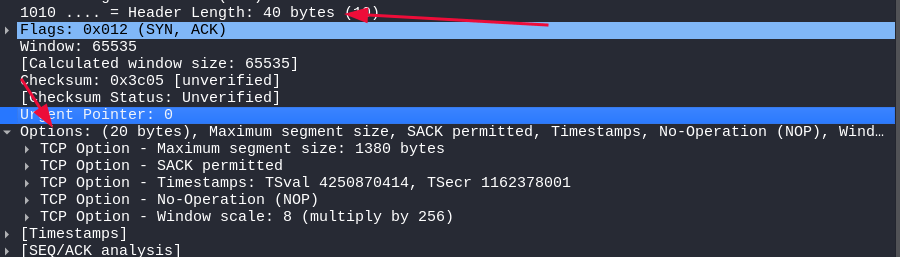
Here we can see a normal TCP header length with 20 bytes of options such as MSS,NOP,Window Scale, SACK.
We can use the following filter to look for header sizes smaller than 40:
tcp.hdr_len < 40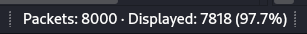
97.7%. That is not normal.
Conclusion
Today, we explored how to detect and analyze DDoS attacks using Wireshark. We focused on SYN/ACK floods, where servers are overwhelmed with response packets from many sources. With Wireshark and MaxMind’s geolocation database, we can trace and visualize this incoming traffic.
Smoking guns for identifying these attacks include:
- A high volume of SYN/ACK packets.
- Unusually small or repeating window sizes.
- Abnormally short TCP header lengths.
These signs, combined with the geolocation data, help you confirm and understand the scale of the attack. Remember to look for repeating patterns.
In summary, you should now have the ability to better detect DDoS attacks.
I trust this guide has proven useful to you, and I thank you for reading.
More Resources
If you didn’t understand something or you need some help, we have our own Discord community and I currently offer free coaching.
You can also leave us some feedback with what you did not understand and we will make sure to correct it.