
Welcome to Logos Red, I go by logos and:
Want to graph attacks coming to your Microsoft Azure network?
In this guide we’ll be visualizing failed RDP events using C# and a GeoIP database locally in Microsoft Sentinel so that we can better understand where our attackers are coming from.
My Promise
This post will finally end your meaningless search for a valid answer, and you will leave with the ability to visualize attacks in Microsoft Azure.
If there are still any questions left, let me know so I can add it to help the next person who will arrive here.
My Goal
To help you improve in less time than it took me and to make sure you leave with what I promised.
I want you to join our community and for this to be a place that you revisit often.
Requirements
- A foundation in cybersecurity, especially terminology: I recommend either the CompTIA Security+ or Google Cybersecurity Professional
- A Free Microsoft Azure Account: https://azure.microsoft.com/en-us/pricing/purchase-options/azure-account
- A Microsoft SIEM Lab such as the one I built here: https://logos-red.com/blog/how-to-build-a-microsoft-azure-sentinel-siem-cybersecurity-lab/
Logic Behind the Script
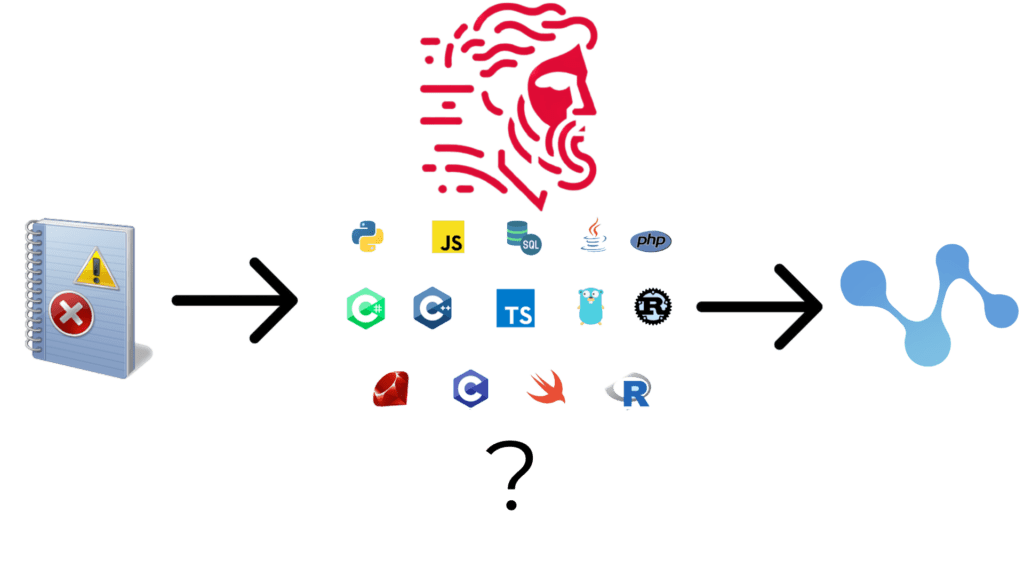
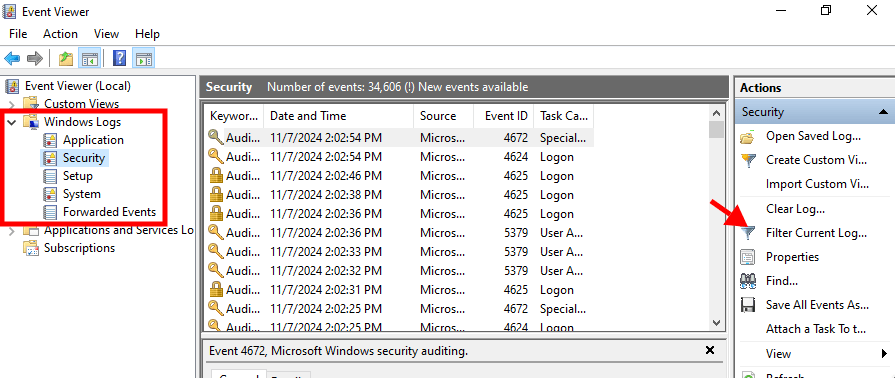
Windows constantly logs data as events happen in “Microsoft Event Viewer” under certain “event IDs.” For example, the security event ID for a failed login event is ID 4625.
We can take a look at said events by going to “Event Viewer” and then “Filter Current Log…”
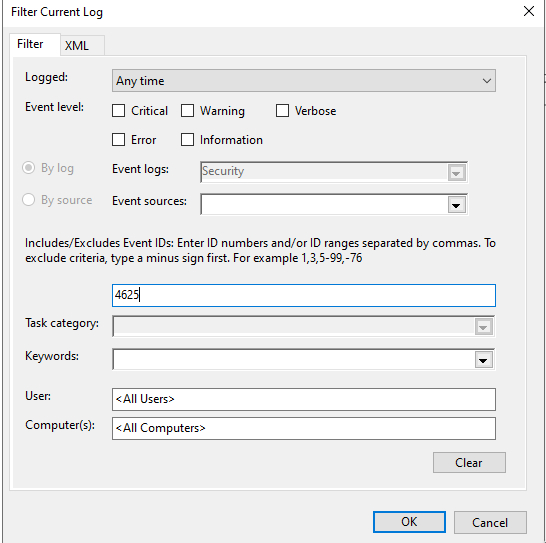
And we can filter for the event ID 4625:
Let’s take the following example, where the IP address “31.43.185.39” has tried to log in using the username “BOB”
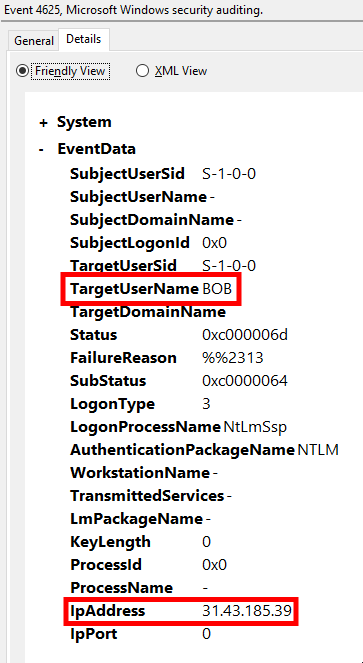
This is a common occurrence that goes unnoticed by most users, but let’s say that we want to figure out where the attacker is coming from.
We could search online as follows:
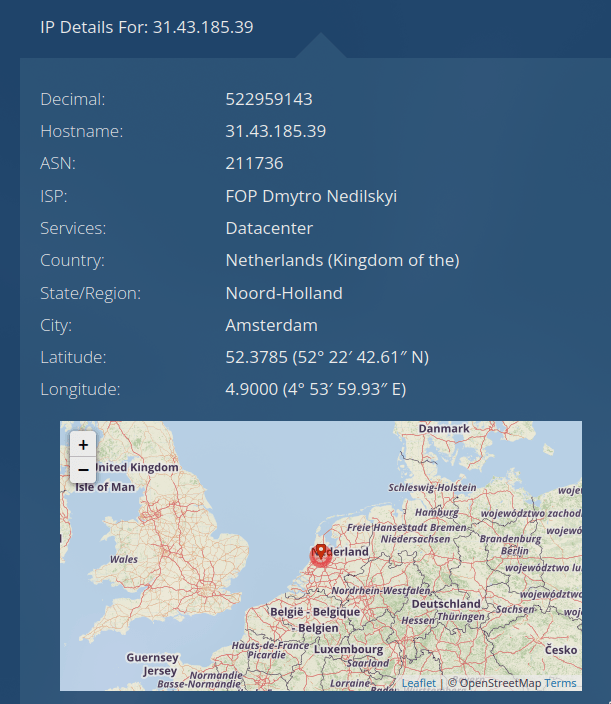
But it’d be pretty tedious to do every single time, so we think about automating it.
Let’s automate it
We want to parse out that IP address from the event viewer and pass it to either an API or a database. We could go the API route, but it’s usually pretty costly as the free versions limit you.
I worked with MaxMind’s GeoIP2 database before (How to Visualize and Detect a DDoS Attack Using Wireshark.) I wondered if they offered any support for programming languages locally, and sure enough, I found a few that interested me:
- Python
- C
- PowerShell through C#
I tried to find any examples or projects that did the same using MaxMind’s database, but found none, so I decided to write my own script.
I first went through the Python route, which provided an easy way to interact with MaxMind’s database. But trying to parse Windows event logs through Python made me age a few years in a few hours.
I then stumbled onto the following article: https://www.linkedin.com/pulse/event-log-geoip-mapping-powershell-automate-series-joep-verhaeg/
And tried to reproduce the same, but once again lost a few hair strands trying to get PowerShell to implement a C# .NET package. In the end I decided to just go to the roots and implement the script directly in C#, which you can find on my GitHub here:
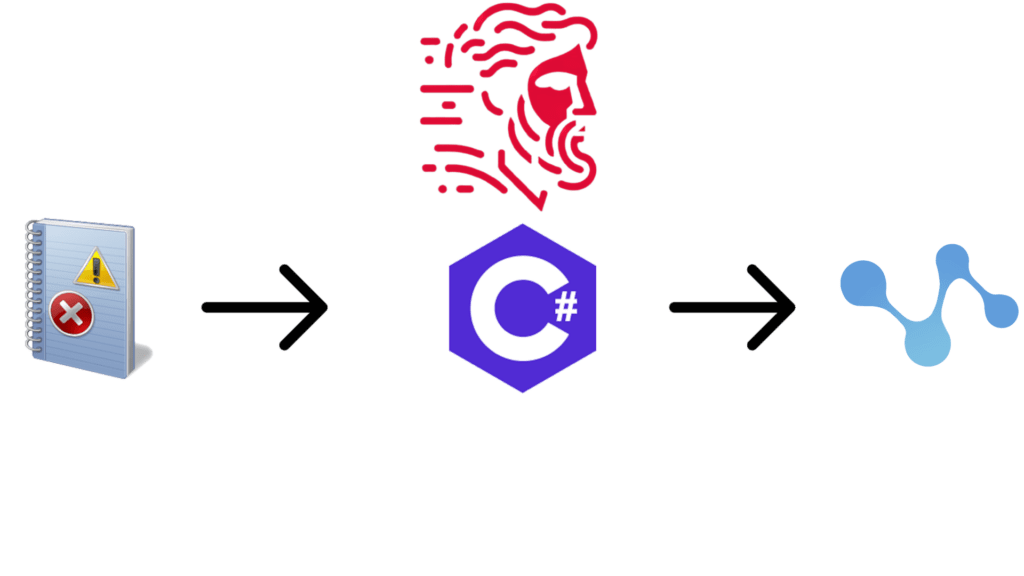
I’ve fully documented the script and the installation steps, you can either go with the .exe from the Releases page but you might get some warnings or you can compile from scratch pretty easily.
Make sure to also get the MaxMind database, and you should be up and running in no time. If you need more help, you can join our community: Discord
Testing the Script
Upon running the script, you should see the following:
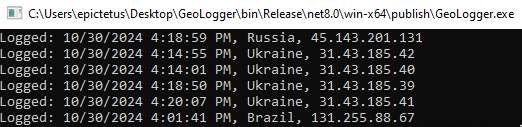
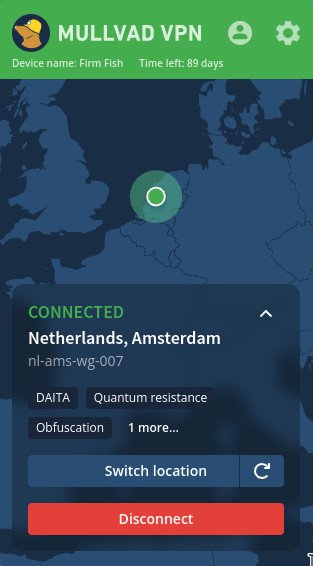
Let’s test if the script works by trying to fail an RDP login. Changing my VPN to the Netherlands:
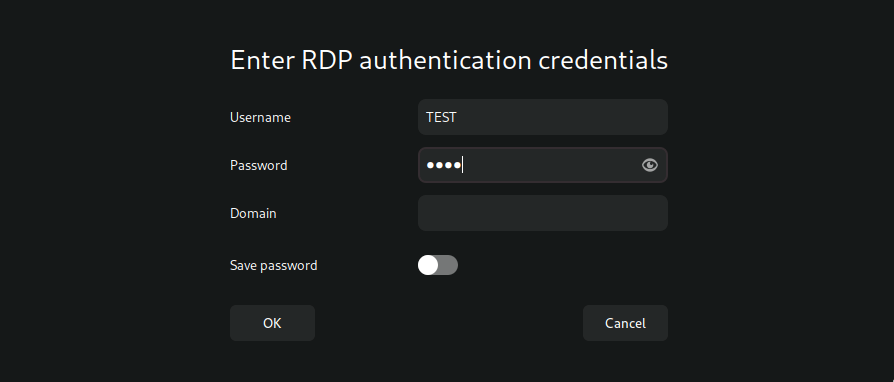
And after waiting 5 minutes for the script to update:

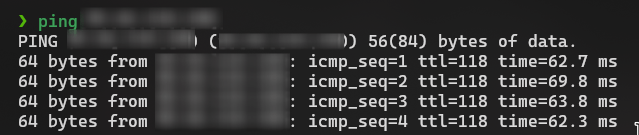
But currently, our machine is not discoverable by others through a ping scan.

So how about we let the floodgates open and turn off our firewall so that we can receive more data on our machine?
Turning off the Firewall for More Data
DISCLAIMER: Never attempt this on an actual machine. This is for demonstration purposes only.
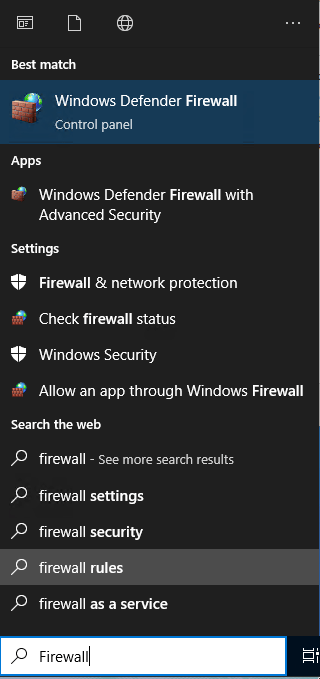
“Turn Windows Defender Firewall on or off”
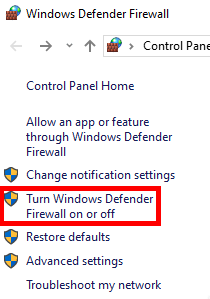
And then “Turn Off Windows Defender Firewall” for both networks.
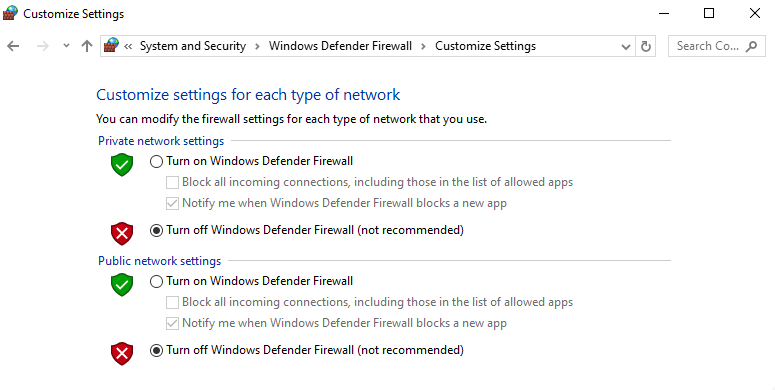
And now our machine should be more easily discoverable by threat actors.
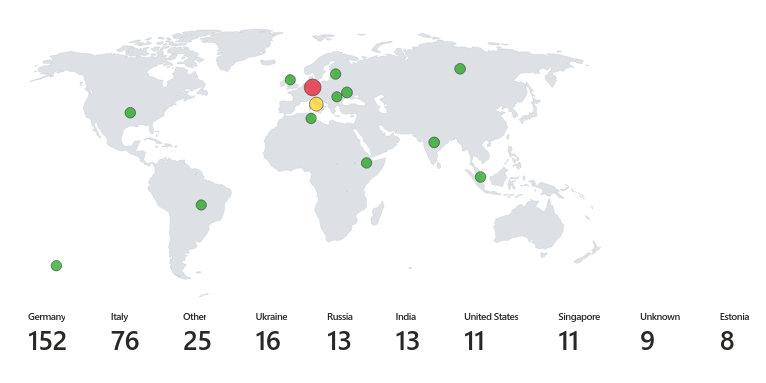
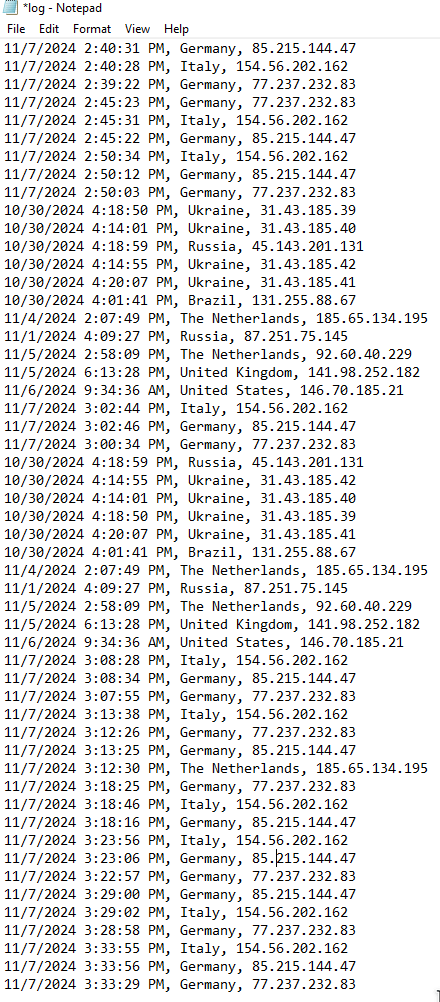
Going into C:\MaxMind\log.txt we should now start to get a clearer picture about our threat actors:
But we don’t want to be staring at a .txt file every time so how about we import it into Microsoft Sentinel?
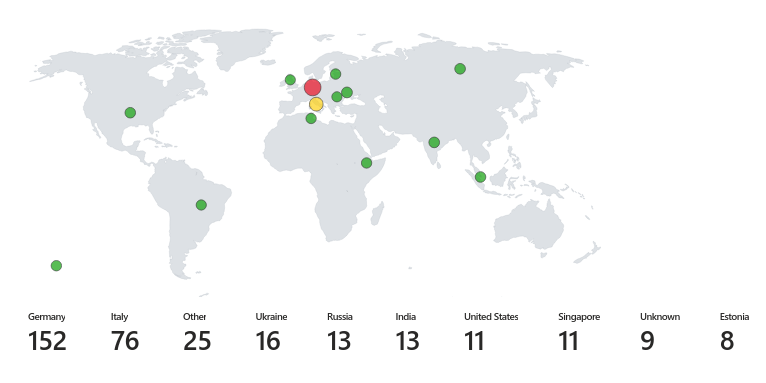
So many German attacks remind me of The Cuckoo’s Egg.
Importing our log file into Microsoft Sentinel
Inside Microsoft Azure, search for “Log Analytics workspaces” and click on your workspace:
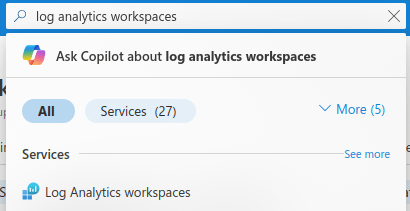
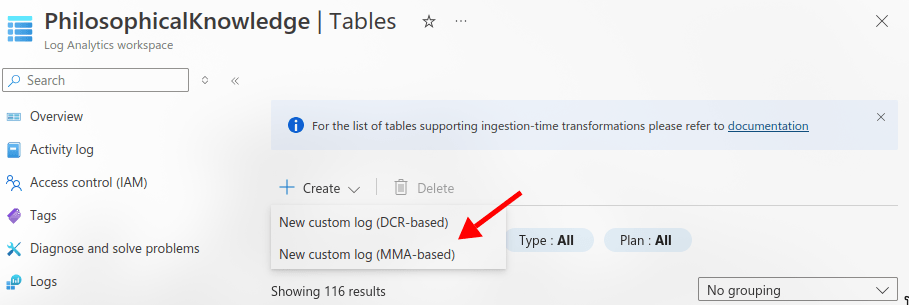
Then Tables -> New custom log (MMA-based)
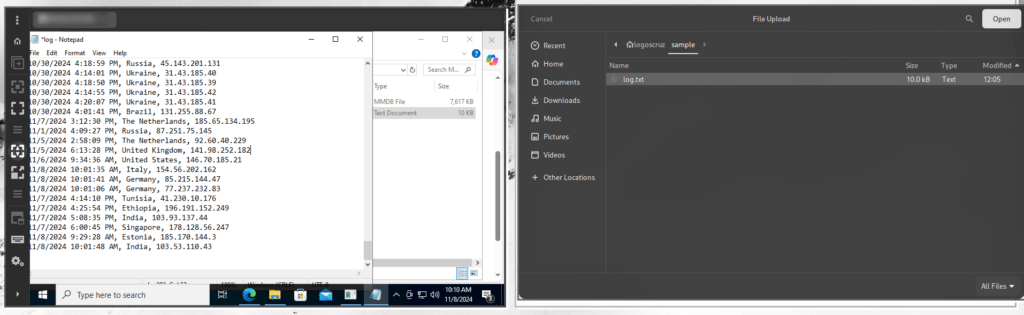
And then copy your log file to your host machine as a sample, and upload it:
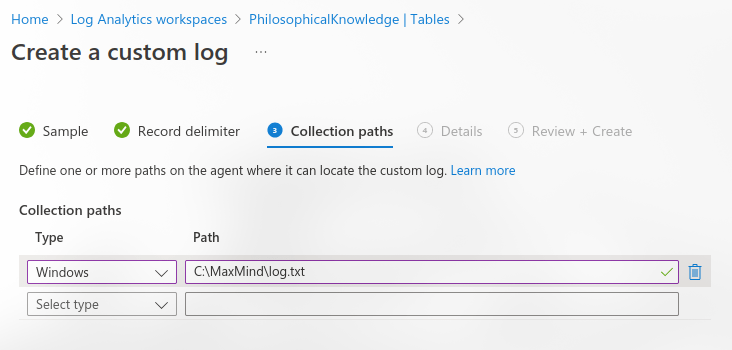
Add your custom log path from your virtual machine:
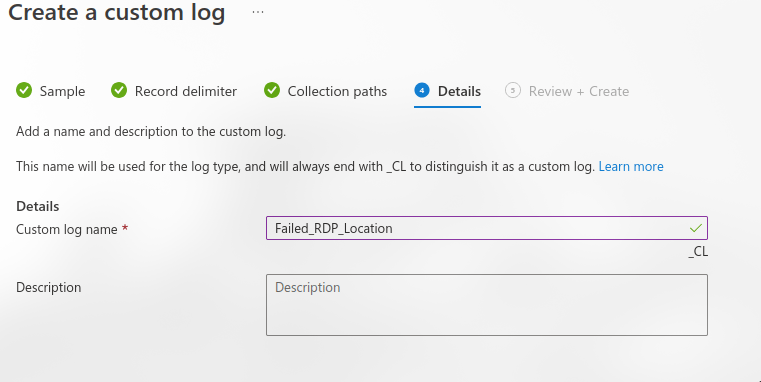
Give it a name and create it:
And this part is where Azure will be awful.
The logs might take 10 minutes to arrive, they might take 10 hours, be patient and eventually they will show up.
You can go to Logs -> New Query -> <name_of_your_query> to view when the log was finally imported.
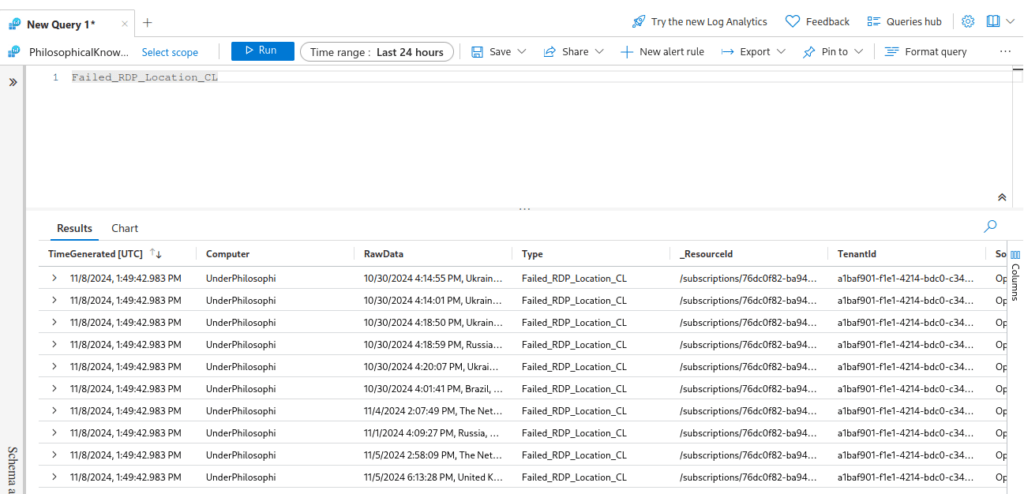
Creating a Visual Map
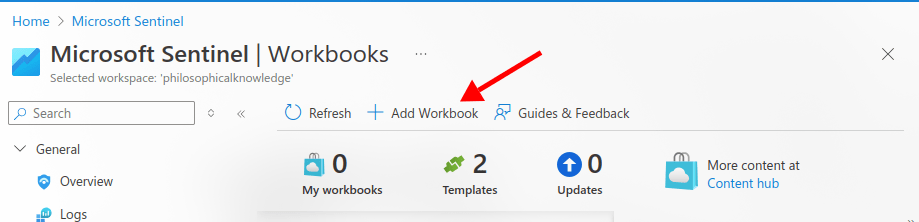
Go to Microsoft Sentinel -> Workbooks -> Add Workbook
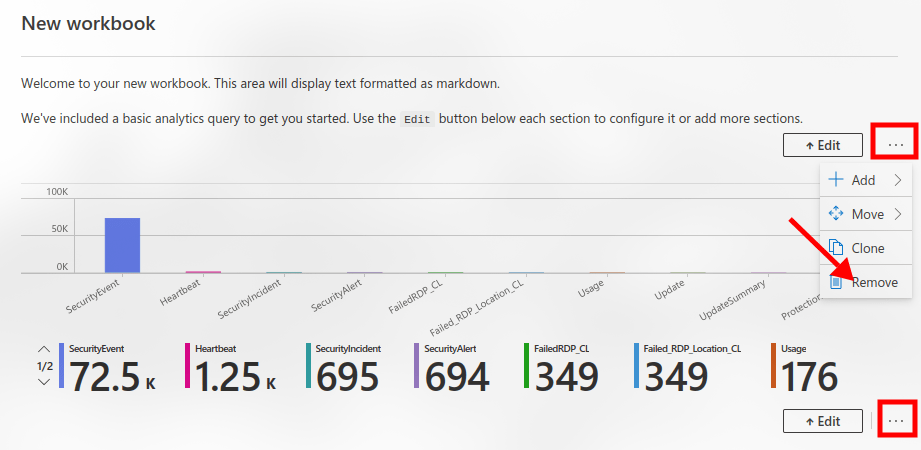
Then Edit:

And remove the two default widgets:
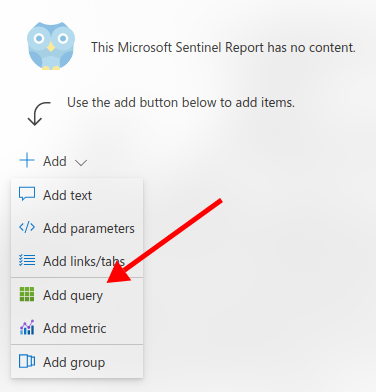
Then “Add query”:
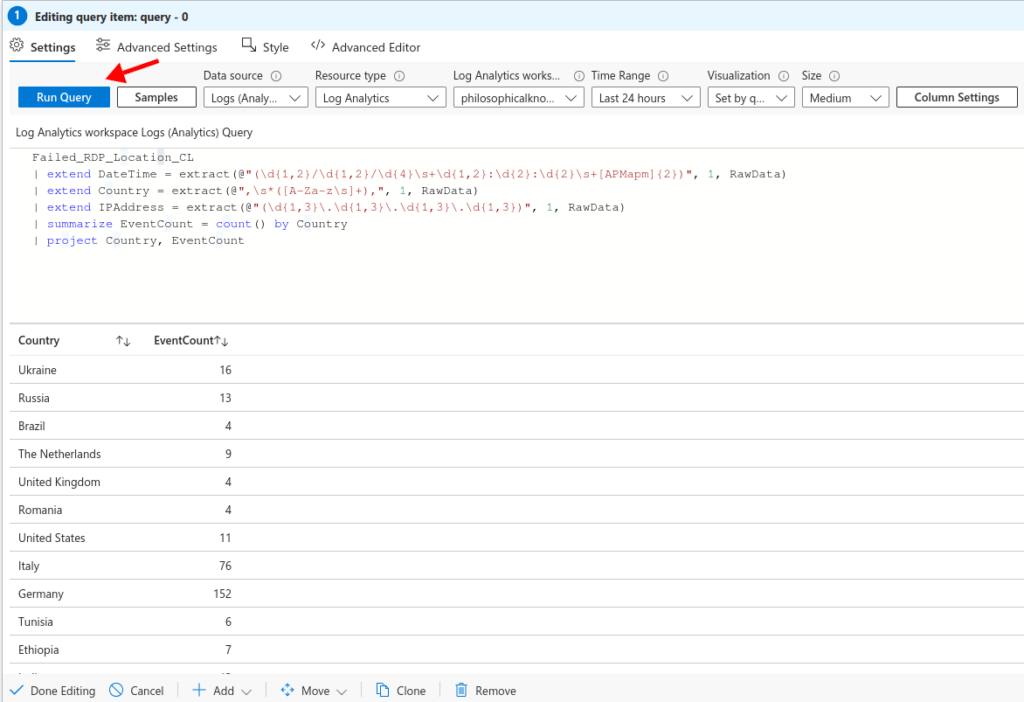
And use the following KQL:
Failed_RDP_Location_CL
| extend DateTime = extract(@"(\d{1,2}/\d{1,2}/\d{4}\s+\d{1,2}:\d{2}:\d{2}\s+[APMapm]{2})", 1, RawData)
| extend Country = extract(@",\s*([A-Za-z\s]+),", 1, RawData)
| extend IPAddress = extract(@"(\d{1,3}\.\d{1,3}\.\d{1,3}\.\d{1,3})", 1, RawData)
| summarize EventCount = count() by Country
| project Country, EventCount
Here we are simply parsing out that raw data into different fields using regex.
Click on “Run Query”:
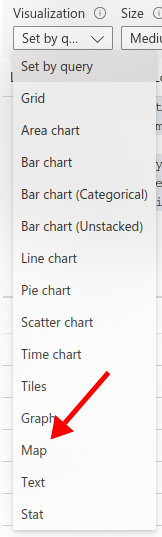
And then set the visualization to “Map”:
And now plot out the map using the country field as such:
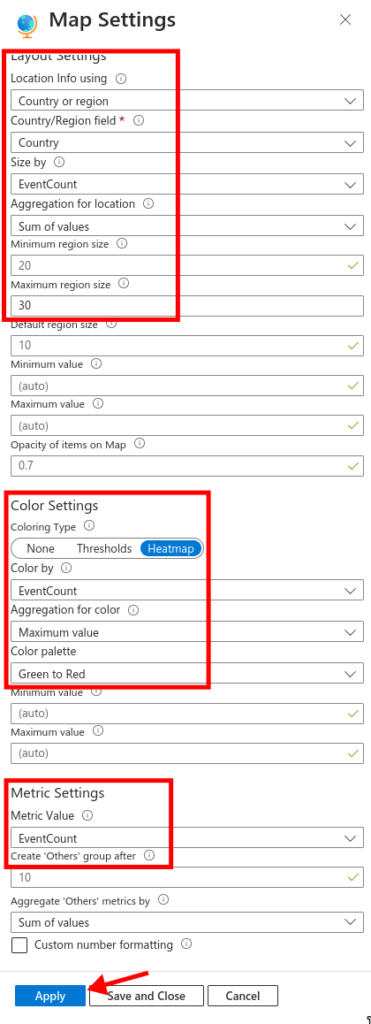
Click on apply, and now we have our beautiful map with all the attacks coming in:
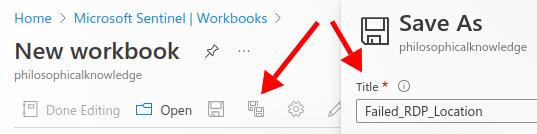
You can finally save your map, and it is done:
Conclusion
In this post, we covered a clear, structured approach to visualizing failed RDP attacks in Microsoft Sentinel. Beginning with the prerequisites, we set up a Microsoft Azure account and a Sentinel lab, with cybersecurity foundations recommended.
We examined Windows Event Viewer to locate failed RDP login events using event ID 4625, capturing essential details like the attacker’s IP address. From there, we automated IP geolocation using MaxMind’s GeoIP2 database, developing a C# script to streamline data extraction.
With the firewall briefly disabled (for testing purposes only), we generated more event data. Then, we imported our logs into Microsoft Sentinel, creating a custom log for visualization. Finally, using KQL, we parsed event details into fields and visualized attack locations on a map, offering a comprehensive view of incoming threats.
By following these steps, you can now track and map failed RDP events effectively in Microsoft Azure.
I thank you for reading, and I trust that this guide has proved useful.
More Resources
If you didn’t understand something or you need some help, we have our own Discord community and I currently offer free coaching.
You can also leave us some feedback with what you did not understand and we will make sure to correct it.